
China's Heat Exchanger Export Markets in 2025: Where Sales Grew and Where They Fell
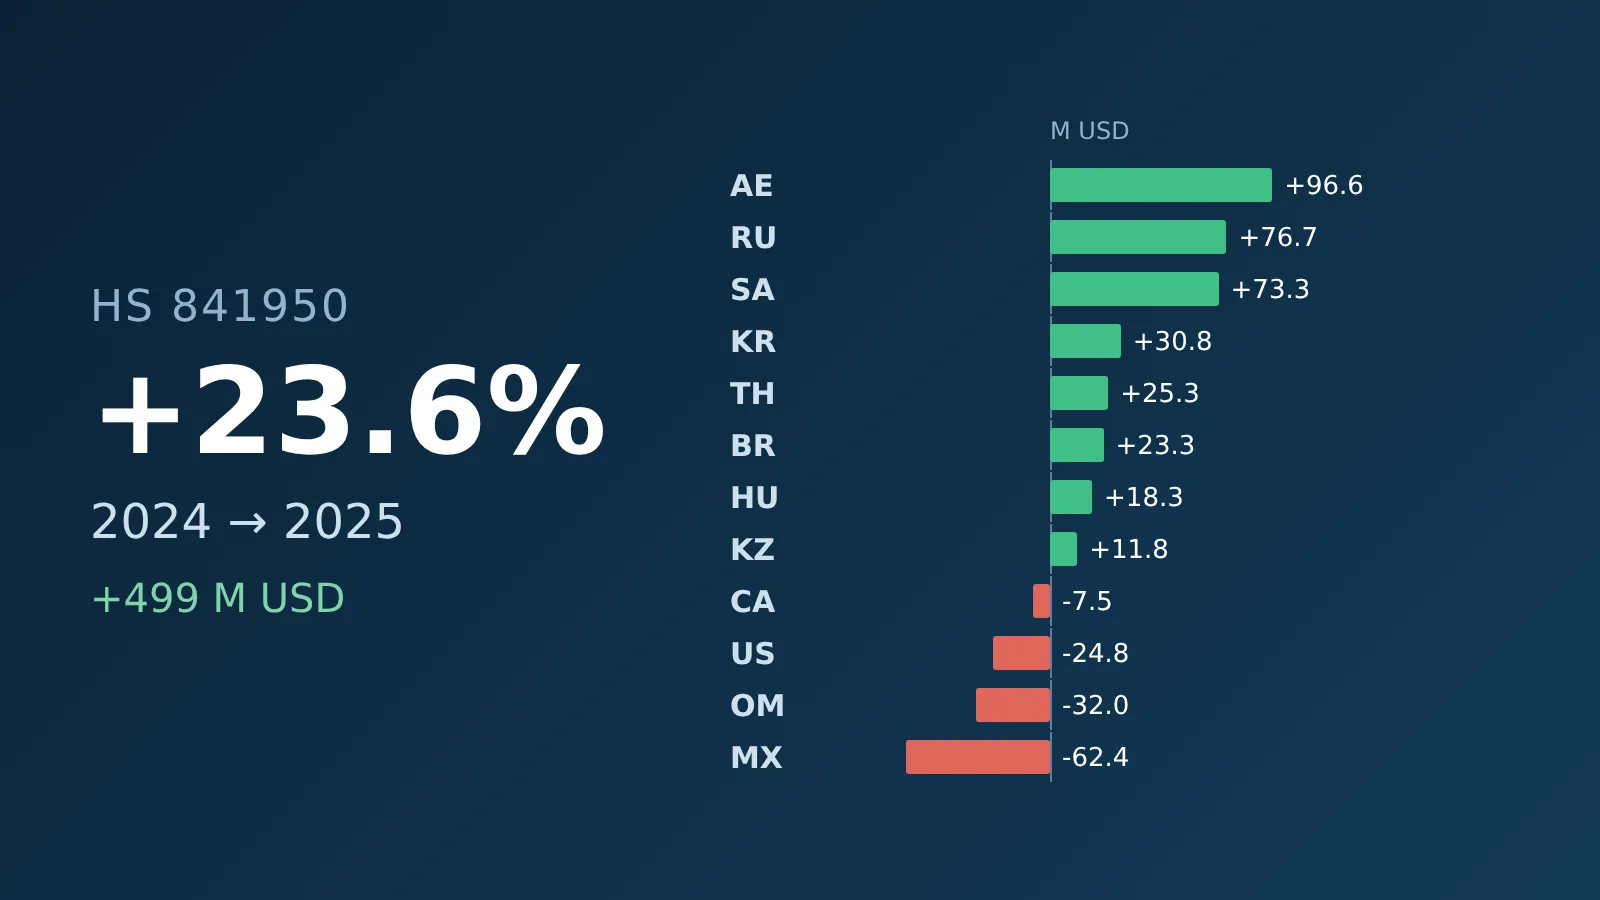
World Bank WITS / UN Comtrade data shows that China exported USD 2,611,463.42 thousand of HS 841950 non-domestic heat exchange units in 2025, up from USD 2,112,449.79 thousand in 2024. That is USD 499.0 million more in one year. This article looks at where that growth came from and which markets went the other way.
The totals, the top five destinations and the largest exporting countries are covered in our earlier articles on HS 841950 trade data and China's exports from 2015 to 2025. All figures below come from WITS China HS 841950 exports 2025 and the same table for 2024 and 2023.
The Ten Largest Increases in 2025
| Market | 2024, USD thousand | 2025, USD thousand | Change, USD thousand | Change |
|---|---|---|---|---|
| Other Asia n.e.s. | 88,010.69 | 234,396.89 | +146,386.20 | +166.3% |
| United Arab Emirates | 50,414.79 | 147,011.59 | +96,596.80 | +191.6% |
| Russia | 176,751.31 | 253,403.05 | +76,651.74 | +43.4% |
| Saudi Arabia | 23,478.86 | 96,782.18 | +73,303.32 | +312.2% |
| South Korea | 73,491.49 | 104,246.52 | +30,755.03 | +41.8% |
| Thailand | 43,577.97 | 68,846.63 | +25,268.66 | +58.0% |
| Brazil | 40,137.20 | 63,460.74 | +23,323.54 | +58.1% |
| Hungary | 5,126.97 | 23,445.20 | +18,318.23 | +357.3% |
| Malaysia | 109,789.66 | 122,213.51 | +12,423.85 | +11.3% |
| Kazakhstan | 26,165.26 | 37,926.80 | +11,761.54 | +45.0% |
These ten markets added about USD 515 million, more than the total increase, because several other markets fell. Saudi Arabia moved from 25th to 9th place among China's destinations, the United Arab Emirates from 12th to 4th, and Other Asia n.e.s. from 6th to 3rd. "Other Asia n.e.s." (not elsewhere specified) is the UN Comtrade label for trade with Asian economies not listed separately.
The Largest Decreases in 2025
| Market | 2024, USD thousand | 2025, USD thousand | Change, USD thousand | Change |
|---|---|---|---|---|
| Mexico | 160,040.79 | 97,662.63 | -62,378.16 | -39.0% |
| Oman | 54,386.17 | 22,377.60 | -32,008.57 | -58.9% |
| United States | 308,985.76 | 284,235.08 | -24,750.68 | -8.0% |
| Iraq | 34,561.18 | 17,238.48 | -17,322.70 | -50.1% |
| Qatar | 11,755.81 | 1,076.10 | -10,679.71 | -90.8% |
| Canada | 30,652.18 | 23,193.50 | -7,458.68 | -24.3% |
| Philippines | 19,506.21 | 13,291.14 | -6,215.07 | -31.9% |
Mexico fell from 3rd to 8th place. The United States stayed China's largest destination, but its value fell 8.0%.
Regional Totals
| Region | 2023, USD thousand | 2024, USD thousand | 2025, USD thousand | Change 2024-2025 |
|---|---|---|---|---|
| Gulf (GCC) | 66,347.33 | 141,551.54 | 269,994.07 | +90.7% |
| Central Asia | 24,345.02 | 55,907.02 | 79,801.69 | +42.7% |
| European Union (27) | 234,806.39 | 181,476.50 | 246,665.60 | +35.9% |
| ASEAN | 327,776.09 | 389,764.61 | 423,808.67 | +8.7% |
| North America | 670,595.40 | 499,678.73 | 405,091.21 | -18.9% |
Gulf (GCC): United Arab Emirates, Saudi Arabia, Oman, Qatar, Kuwait and Bahrain. Central Asia: Kazakhstan, Uzbekistan, Turkmenistan, Kyrgyzstan and Tajikistan. ASEAN: the ten member states. North America: United States, Mexico and Canada. The regional totals are our sums of the country figures in WITS.
North America's share of China's exports under this code fell from about 23.7% in 2024 to 15.5% in 2025, while the Gulf's share rose from about 6.7% to 10.3%.
What the Numbers Suggest
The Gulf grew, but not evenly. Saudi Arabia and the United Arab Emirates drove the increase, while Oman, Iraq and Qatar fell sharply. The value per recorded item is very high in Saudi Arabia: about USD 16,800 in 2025, against about USD 5,900 in 2024. That points to large project equipment rather than many small units. Project markets can swing strongly from one year to the next, as Canada did after 2023.
Russia and Central Asia kept growing. Russia rose 43.4% to USD 253.4 million and remained China's second-largest destination. Kazakhstan rose 45.0% and Uzbekistan 15.0%.
North America fell. Mexico dropped 39.0%, Canada 24.3% and the United States 8.0%. The trade data shows the change but not its causes.
Europe recovered. EU countries together bought 35.9% more than in 2024, slightly above their 2023 level. Hungary rose from USD 5.1 million to USD 23.4 million.
What This Means for Buyers
- Look at several years, not one. Large single projects can make a market jump or fall in one year. Before reading a trend into one market, check the 2023, 2024 and 2025 figures together.
- Ask for references in your region. Where exports grew fast, Chinese suppliers are more likely to have recent projects in your country or region. Ask for reference projects and the documents they supplied there, such as code stamps, certificates and inspection records.
- Plan lead times and documents early. For project equipment, agree on design codes, third-party inspection and shipping documents at the quotation stage, not after the order.
If you are planning a purchase, our guides on verifying a Chinese heat exchanger manufacturer and the heat exchanger RFQ checklist cover the next steps, and the RFQ form is open for specific projects.
Data Notes
HS 841950covers non-domestic heat exchange units. It does not separate plate, shell-and-tube, brazed, welded or air-cooled designs, so these figures cannot show which type grew.- Quantities are recorded in items, and an item can be anything from a small brazed unit to a large project exchanger. Values per item are only rough signals.
- WITS figures can be revised when countries update their data.