
China's Non-Domestic Heat Exchange Unit Export Markets in 2024
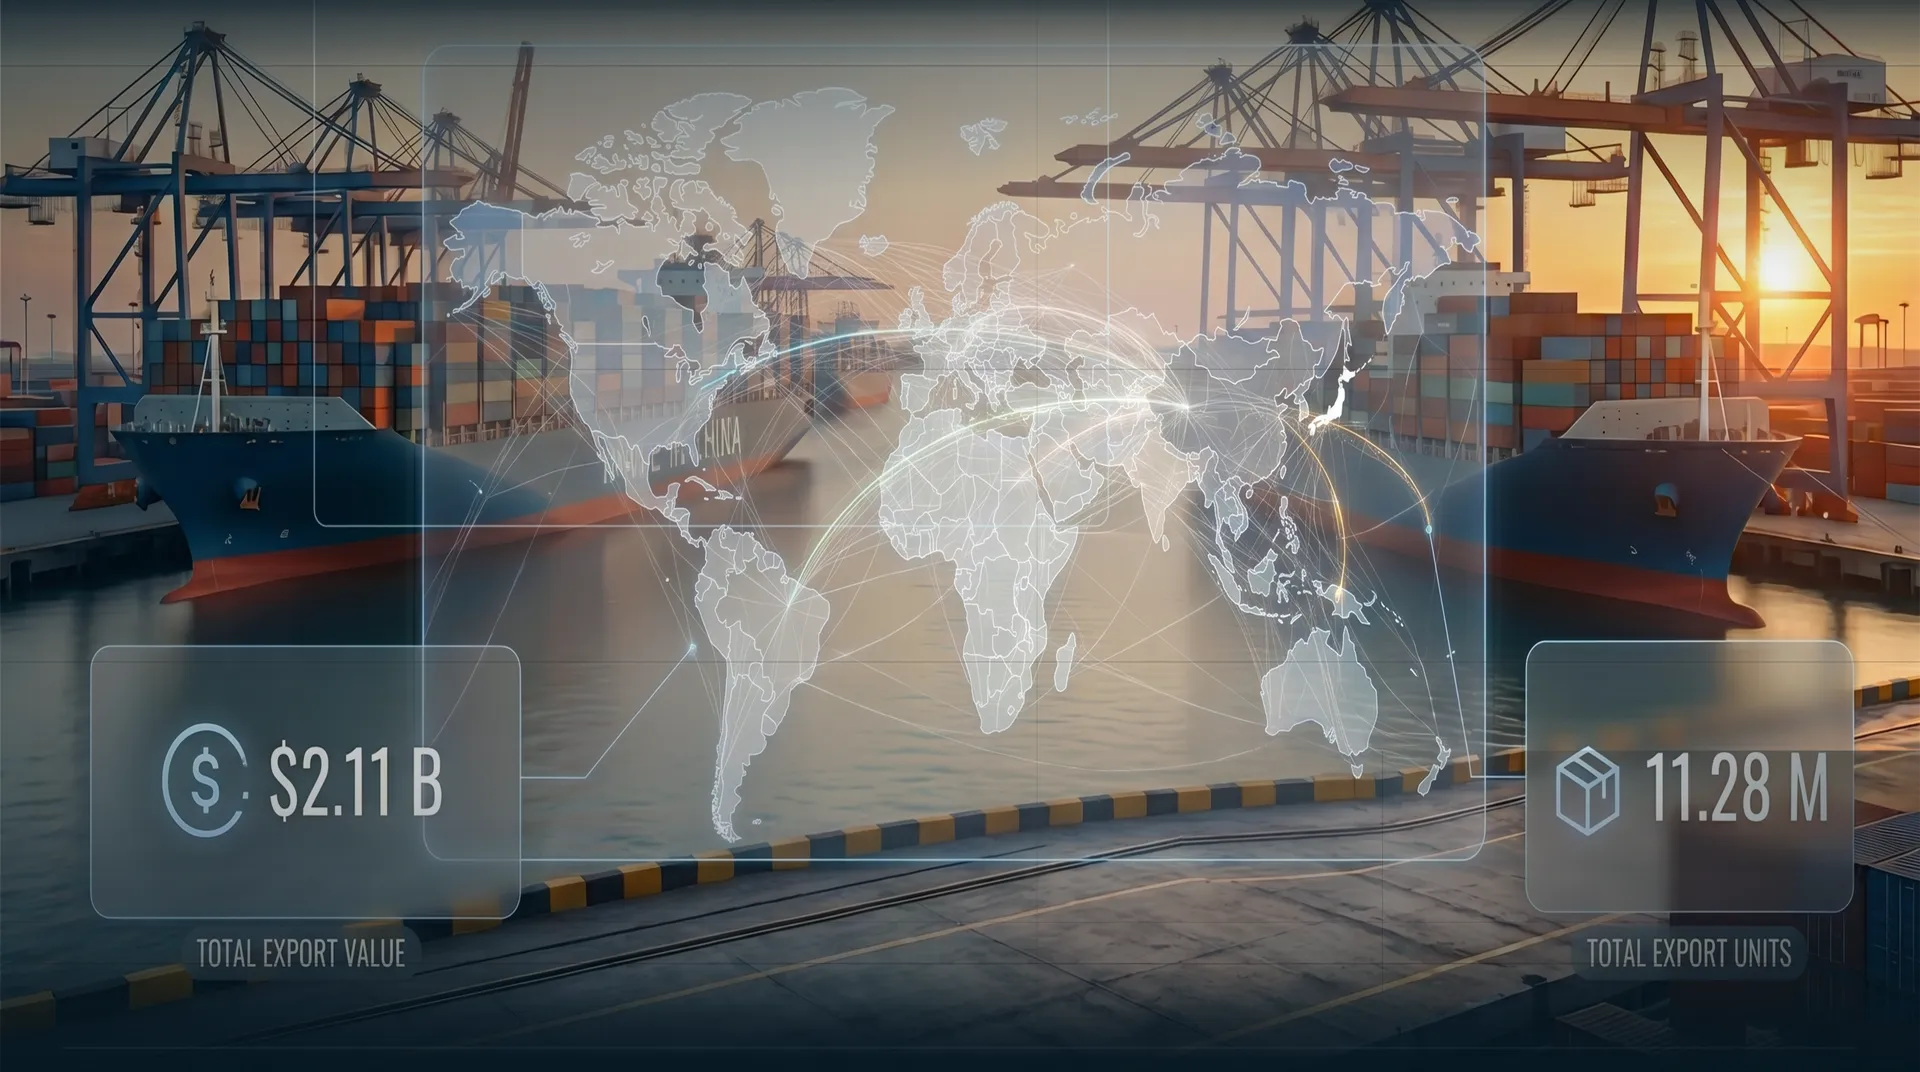
World Bank WITS / UN Comtrade data shows that China exported USD 2,112,449.79 thousand of HS 841950 non-domestic heat exchange units in 2024, with a recorded quantity of 11,283,600 items. The top five destinations were the United States, Russia, Mexico, Malaysia and Indonesia.
The UNSD statistical wording for HS 841950 is non-domestic heat exchange units. Data sources: WITS China HS 841950 exports 2024, WITS HS 841950 exporters 2024 and UNSD HS 841950.
China's Top Five Export Destinations in 2024
| Rank | Destination | Export value, USD thousand | Export quantity, items | Source |
|---|---|---|---|---|
| 1 | United States | 308,985.76 | 891,196 | WITS 2024 |
| 2 | Russia | 176,751.31 | 213,736 | WITS 2024 |
| 3 | Mexico | 160,040.79 | 1,847,460 | WITS 2024 |
| 4 | Malaysia | 109,789.66 | 419,202 | WITS 2024 |
| 5 | Indonesia | 101,878.36 | 45,804 | WITS 2024 |
The top five destinations together accounted for USD 857,445.88 thousand, or about 40.59% of China's 2024 export value under HS 841950.
Largest Exporting Countries in 2024
| Rank | Country | Export value, USD thousand | Source |
|---|---|---|---|
| 1 | China | 2,112,449.79 | WITS global exporters 2024 |
| 2 | United States | 1,698,176.55 | WITS global exporters 2024 |
| 3 | Germany | 1,302,984.71 | WITS global exporters 2024 |
| 4 | Italy | 1,195,067.03 | WITS global exporters 2024 |
| 5 | South Korea | 785,331.66 | WITS global exporters 2024 |
The European Union, counted as one bloc, exported USD 2,958,543.53 thousand in 2024. That total already includes Germany, Italy and the other member states, so it is not ranked here alongside individual countries.
North America Market Data
| Market | China export value, USD thousand | Export quantity, items | Source |
|---|---|---|---|
| United States, 2024 | 308,985.76 | 891,196 | WITS 2024 |
| Mexico, 2024 | 160,040.79 | 1,847,460 | WITS 2024 |
| Canada, 2022 | 217,246.42 | 80,424 | WITS 2022 |
| Canada, 2023 | 311,411.77 | 88,172 | WITS 2023 |
| Canada, 2024 | 30,652.18 | 221,237 | WITS 2024 |
Canada was China's largest destination in 2022 and 2023 but fell to USD 30.7 million in 2024 and USD 23.2 million in 2025. The 2022 and 2023 shipments had a very high value per item (about USD 2,701 and USD 3,532, against about USD 139 in 2024), which suggests a few large project orders rather than steady demand.
Asia-Pacific Market Data
| Market | China export value, USD thousand | Export quantity, items | Source |
|---|---|---|---|
| Malaysia, 2024 | 109,789.66 | 419,202 | WITS 2024 |
| Indonesia, 2024 | 101,878.36 | 45,804 | WITS 2024 |
Annual Destination Changes
| Year | Top five destinations | Canada export value, USD thousand | Source |
|---|---|---|---|
| 2022 | Canada, Mexico, United States, Indonesia, Japan | 217,246.42 | WITS 2022 |
| 2023 | Canada, Mexico, United States, Indonesia, Japan | 311,411.77 | WITS 2023 |
| 2024 | United States, Russia, Mexico, Malaysia, Indonesia | 30,652.18 | WITS 2024 |
| 2025 | United States, Russia, Other Asia n.e.s., United Arab Emirates, Malaysia | 23,193.50 | WITS 2025 |
2025 Update
2025 data is now available. China's HS 841950 exports rose 23.62% to USD 2.61 billion. The United States and Russia stayed first and second. Other Asia n.e.s., the United Arab Emirates and Malaysia completed the top five, while Indonesia fell to seventh and Mexico to eighth. Full 2025 figures are in HS 841950 trade data.
“Other Asia n.e.s.” (not elsewhere specified) is the UN Comtrade label for trade with Asian economies not listed separately.
Data Summary
In 2024, China's HS 841950 export destinations covered North America, Eurasia and Southeast Asia. The United States, Russia, Mexico, Malaysia and Indonesia were the top five destinations, accounting for about 40.59% of China's export value under this code.
Among individual countries, China was the largest exporter under this code in 2024, with USD 2.11 billion, ahead of the United States, Germany, Italy and South Korea. Only the European Union taken as a whole exported more.